选择页面

中国科学院

2019-2024

可视化设计
用户体验设计

数据分析
可视化开发
易用性分析

第一个大规模分析平台用于探索演讲效果。
通过与研究人员合作四年,共同创建了三种不同的视觉分析系统。

中国科学院

2019-2024

可视化设计
用户体验设计

数据分析
可视化开发
易用性分析

第一个大规模分析平台用于探索演讲效果 。已在顶级可视化期刊TVCG和会议IEEE VIS上发表两次。获得了两项专利和项目资金扩展。

At the start of the project small scale analysis showed patterns between the emotion of a speaker and contest ranking, inspiring further research.

The founder of Infodesign Studio began to collect contest speeches, wondering if large scale analysis can bring insights. The speeches were processed using affective computing methods.

The first system allows speakers to test theories about what factors go into speech effectiveness. Infodesign Studio worked on creating analysis metrics, creating the requirements of the system, visualizations, and the design of the system.

Emotional twists were significant in speeches we researched, we developed e-spiral so these shift could be compared.

Are there patterns in speeches related to their success? How do factors such as speech rhythm, vocabulary, and various emotional metrics impact performance across nationalities?

As we found significant relationships between factors, we wondered how best to support speakers to find patterns on their own.  How could data be shown in a way that people can readily identify? 

E-script directly shows emotion, word speed, pause and pace though typography.

In the next stage in our research, we went beyond testing theories to aiding speakers to understand how their speech differs from other contestants.

For online speeches, what are the most similar and different speeches in terms of emotion, gestures, eye contact, stage movement, and other factors. Could we learn from speakers with different expressive patterns?

So far collaboration has resulted in two patents (and two more pending), project funding expansion, and publication in the top visualization journal TVCG and conference IEEE VIS. As technology advances and more accurate methods of quantifying information about speeches are developed, new ways of delivering insights can improve the many goals of speakers with sales targets, entertainment objectives, and persuasive intents.

Infodesign Studio的创始人开始收集比赛演讲,想知道大规模分析是否能带来见解。这些演讲通过情感计算方法进行了处理。

在项目开始时,小规模分析显示了演讲者的情感与比赛排名之间的模式,这激发了进一步的研究。

第一个系统允许演讲者测试哪些因素影响演讲效果。 Infodesign Studio致力于创建分析指标、制定系统需求、可视化和系统设计。

当我们发现因素之间存在显著关系时, 我们想知道如何最好地支持演讲者自己发现模式。如何以一种人们能够轻松识别的方式展示数据? 

我们研究的演讲中,情感转折是显著的因素,因此我们开发了e-spiral,以便比较这些变化。

E-script直接通过排版显示情感、语速、停顿和节奏。

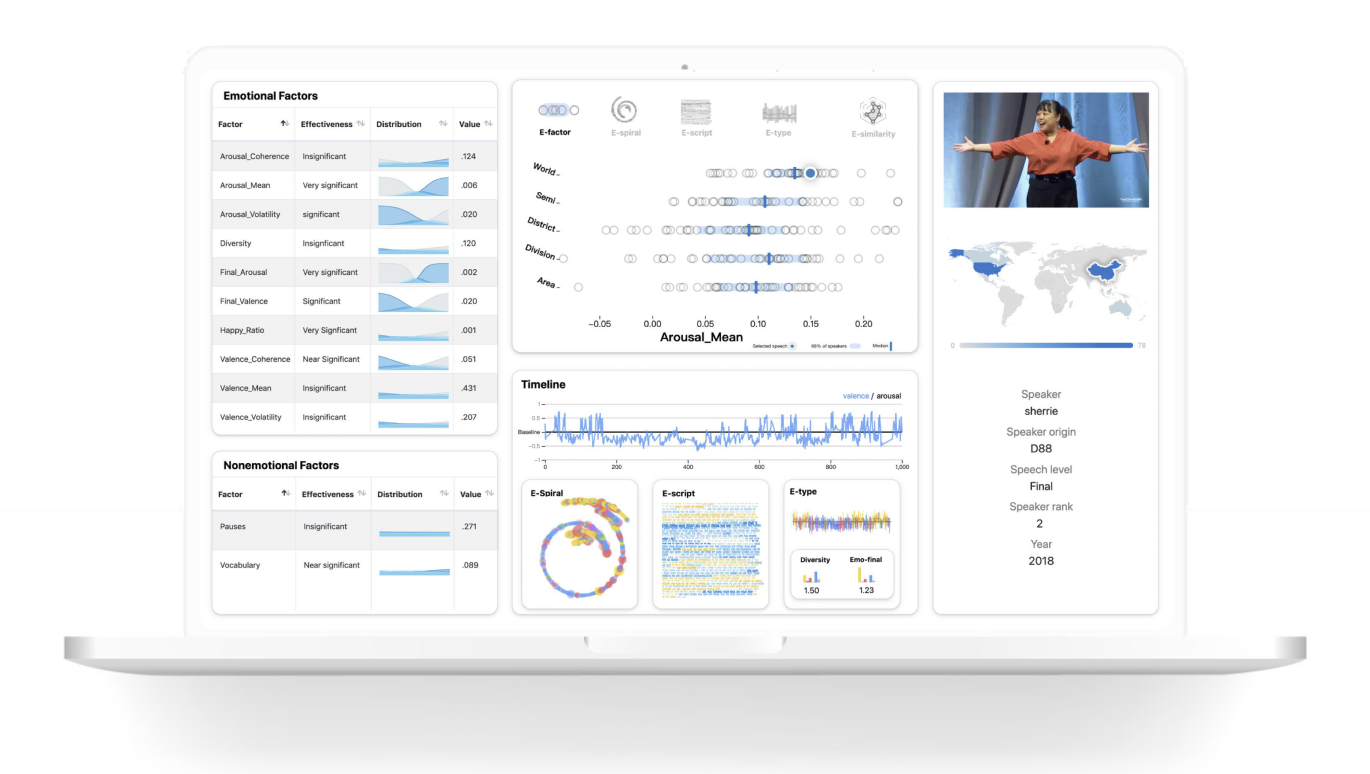
演讲的成功存在于哪些模式? 演讲节奏、词汇和各种情感指标等因素如何影响不同国籍的表现?

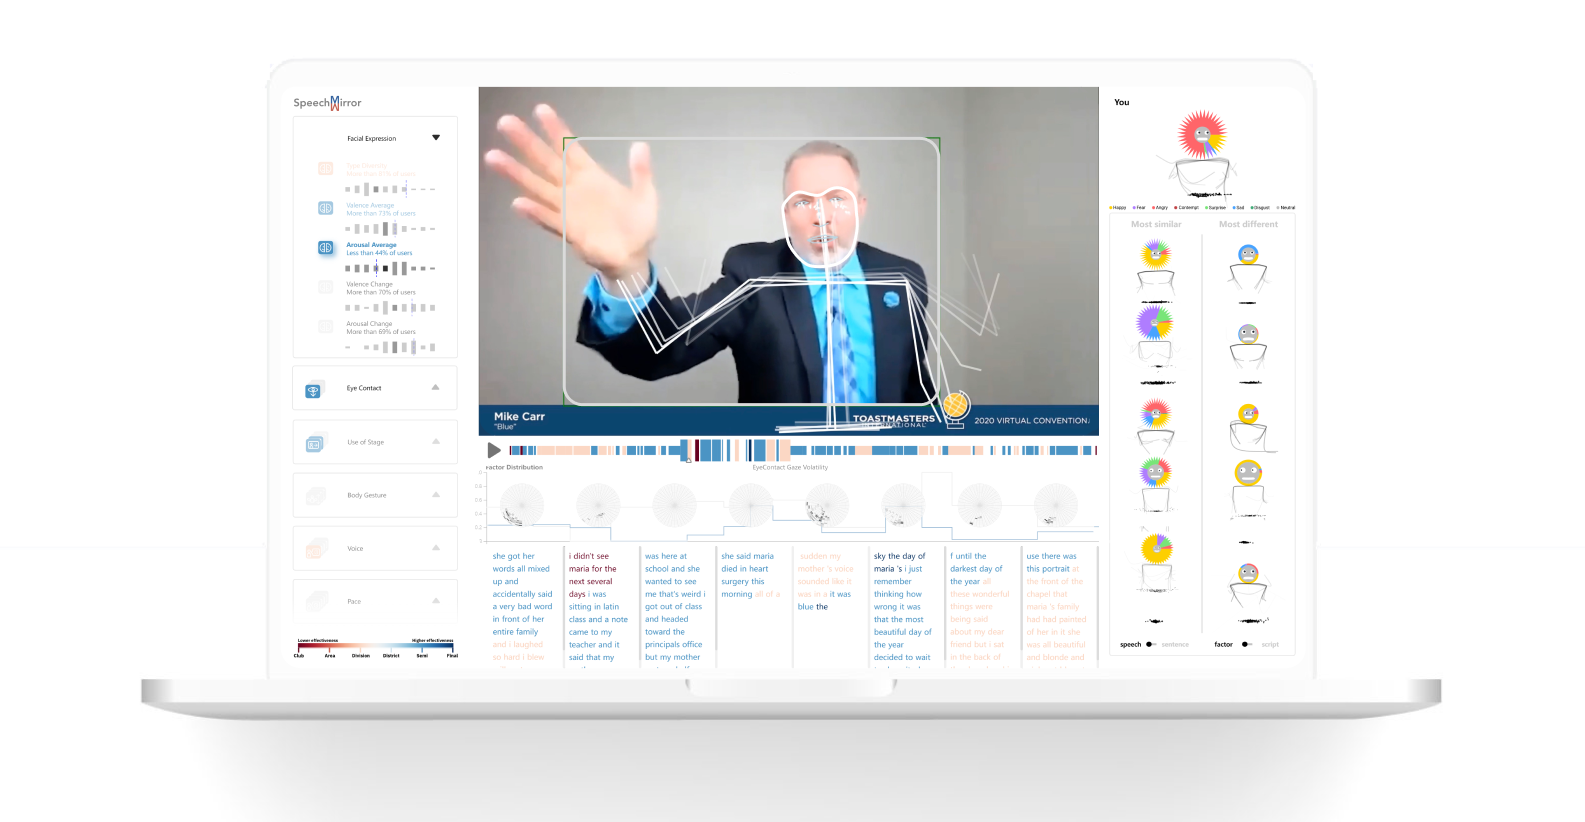
在我们研究的下一个阶段,我们不仅测试了理论,而且还帮助了演讲者了解他们的演讲与其他参赛者的不同之处

对于在线演讲,情感、手势、眼神接触、舞台移动和其他因素方面,最相似和最不同的演讲是什么样的?我们能从具有不同表达模式的演讲者中学习吗?

随着技术的进步和更精确的演讲信息量化方法的开发,提供见解的新方式可以改进演讲者在销售目标、娱乐目的和说服意图方面的许多目标。